Turn Off. Tune Out. Get Rich.
Years from now financial historians will look back at 2017 and find the investment pundits engaged in a vigorous debate about the direction of the stock market, perhaps more so than at any other time in the last 10 years.
This isn’t just some academic discussion, as a lot is at stake for the average investor. Follow the wrong prophet and you’ll fall behind. If you’re fully invested and equities fall precipitously, you run the risk of losing a significant chunk of your net worth and having to postpone retirement, if not worse. Err on the side of excessive caution in an ongoing bull market and you’ll have created an “opportunity cost” for yourself, leaving you relatively less wealthy in a wealthier world, meaning that you might struggle to provide yourself with the same standard of living for such things as housing, your children’s college education, retirement, etc.
The debate can be succinctly summarized as follows: in terms of valuations the market looks expensive (to most observers, anyway), yet in terms of price behavior the market is signalling green shoots ahead. On the cautious/bearish side you’ll find such heavyweights as Howard Marks, Seth Klarman, John Hussman, Steven Bregman, and others. On the bullish side you have other big hitters like Byron Wien, Scott Grannis, and the seemingly ever-bullish Jeremy Siegel.
What is the evidence for each, you might ask?
Bearish Signals
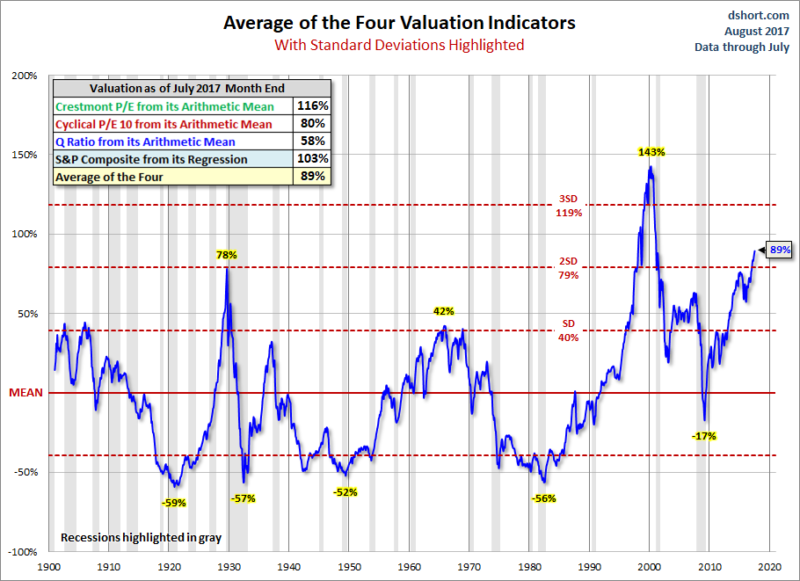
In terms of valuation, this market is indeed richly priced. When one looks at readings such as Robert Shiller’s CAPE ratio, Tobin’s Q ratio, Price/Sales, Price to Cash Flow, and Warren Buffett’s favorite indicator, stock market capitalization to GDP, they are all at or near record highs in terms of stretched valuations. The only time in history that the composite of readings was higher was at the peak of the Internet Bubble in early 2000, and even then the current Price/Sales ratio is currently higher than at that time. For the visually inclined, here’s a useful chart that represents a composite of valuation indicators (P/E ratios, Q Ratio, etc., courtesy of Jill Mislinski at dshort.com) that puts the stock market’s current valuation in historical perspective:
 Source: Advisor Perspectives, dshort.com
As you can see the current reading exceeds every prior market peak with the exception of 1999/2000. While it’s true that some of these indicators have better long-term signals than short-term, they do paint a cautious picture. And for those who believe that today’s low interest rates justifies these valuations, John Hussman points out the limitations of relying on interest rates as an adequate foundation for extrapolating stock market returns. Low interest rates alone don’t necessarily justify these valuations, both because long-term earnings are more a function of long-term economic growth than current rates, and the likelihood that either rates will rise during the intervening years or that today’s low rates are signalling weaker economic growth ahead than equity participants are forecasting, such that either inflation or recessionary pressures will affect the real value of future earnings streams.
Bullish Signals
On a more positive note, recent stock market behavior is undeniably bullish. Typically a bear market is preceded by two tell-tale signs: weakness in the financial sector, and divergence in price behavior among individual stocks, neither of which is present today.
At the moment the financial sector is sending a bullish signal. Financials were the 3rd strongest performing sector over the last 3 months, notching gains of nearly 5% vs. less than 4% for the S&P 500.
The other supportive factor is stock market divergence, or lack thereof. Divergence is a measure of the disparity of price movement among stocks; the more that price behavior is tightly clustered, the more bullish, and vice versa. The rationale is that an unhealthy market reveals itself by price divergence, as some stocks begin to weaken, signalling signs of broader trouble ahead. According to David Aronson, adjunct finance professor at Baruch College, recent market behavior shows no signs yet of meaningful divergence.
Adding to this evidence is the technical backdrop for technology stocks. The following chart is revealing, showing the Nasdaq recently breaking through long-term price resistance when it pierced above the 5,000 level.
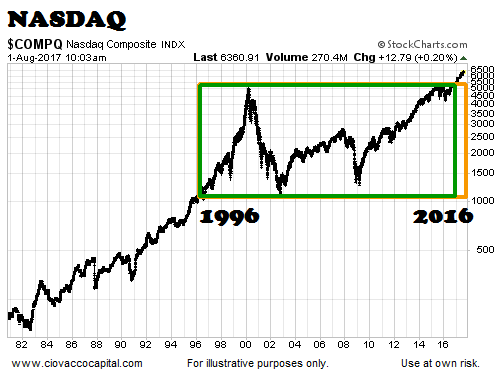
Source: Ciovacco Capital
Do I Have To Choose?
The conflicting evidence is enough to make one’s head spin. And what if both arguments have merit, but on slightly different timetables? For example, it wouldn’t be unreasonable to conclude that a meaningful bear market is on the horizon but not yet upon us, perhaps laying dormant while the market makes engages in one last “melt-up”, pushing up prices and sucking in investors until the last bear has thrown in the towel (much like it did between 1999-2000).
Furthermore, astute readers who are considering the bearish scenario will recognize that this entire exercise requires not just one decision but two; namely: 1. when to “de-risk” one’s portfolio and, 2. when to turn the risk exposure back on. It does little good to get cautious only to miss out on the ensuing rally.
For that reason and others it is useful to consider an entirely different approach, one that extricates an investor (somewhat) from the roller-coaster ride that typifies the traditional equity indices.
A Less Risky Approach: Quality-Value-Momentum
What if there were a way to achieve better long-term investment performance, and with less risk, than the typical equity benchmark? An approach that, at least historically speaking, mitigates downside risks such that long-term investors could reframe their focus away from market-timing and toward long-term wealth creation?
In a recent study by S&P Global, they identify such an approach. By building an equity portfolio of stocks identified not by their market capitalization but on the factors of Quality, Value and Momentum, investors would have earned more and done so with less downside risk. They find that from December 1994 through January 2017, such a portfolio would have outperformed the better known S&P 500 index with annualized returns of 10.50% vs 5.50% and with volatility of 14.40% vs. 15.70%, respectively. Furthermore, their multi-factor Quality-Value-Momentum index wasn’t the result of a few periods of outperformance, but outperformed in 83% of all months tested.
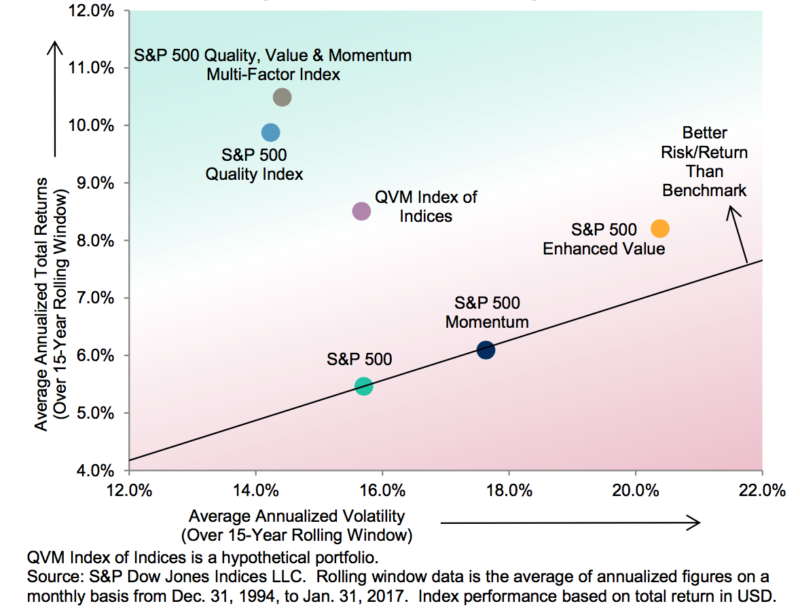
Source: S&P Global. Past Performance is not a guarantee of future returns.
The beauty of this strategy is its relative strength in all manner of stock market environments. Whether conditions are bullish or bearish, this strategy has offered consistently strong performance historically. It’s important to add that no equity portfolio is immune from bear markets, and this strategy is no exception. But market-timing is difficult if not impossible, and therefore this multi-factor strategy may represent one of the best solutions for risk-conscious investors.
